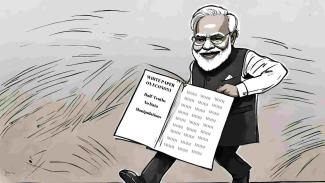
The "White Paper on the Indian Economy" presented by the Union Finance Minister in parliament on February 8, has alleged that the previous UPA government had left behind a "deeply damaged economy" marred by "governance, economic and fiscal crises" in 2014. The paper claims that the Modi government has "turned around" and "rebuilt" the economy from its foundations in the past ten years. The 55 pages document, however, mentions the word "inflation" thirty four times, while the words "jobs" and "employment" are mentioned only twice and "unemployment" never at all; which exposes the skewness of its analysis.
Public Finances
The true picture of public finances and macroeconomic performance under the UPA and NDA regimes emerges quite plainly from the official data provided by the union budget documents, ministry of statistics and the central bank. Public finance data for the four governments in the past twenty years does not reflect any discernible trend towards gradual deterioration of fiscal indicators in the first ten years and continuous improvement in the last ten.
Rather, average annual total expenditure, along with that of revenue and capital expenditure (capex), shows a decline as a percent of GDP under the NDA-I government from the levels attained under the UPA regime. It was with the fiscal expansion of the post-pandemic period, that the NDA-II government's total spending rose significantly.
The NDA-I government had reduced expenditures relative to GDP on most major heads compared to the UPA regime, including capex, subsidies, defence, education and rural development. NDA-II increased the outlays on those heads significantly vis-a-vis NDA-I. However, the expenditure record of the NDA-II government vis-a-vis the UPA era remains mixed; outlays on capex, food subsidy, agriculture, urban and rural development improved, while outlays on education, defence and subsidies on fuel and fertiliser fell, as per cent of GDP. Health expenditure as a share of GDP witnessed no change at all between UPA and NDA rule, despite the Covid-19 pandemic.
On the revenue front, gross tax revenues in GDP showed minor improvement during the NDA rule compared to UPA's, but non-tax revenues deteriorated. Overall there was a decline in Centre's revenue receipts as a share of GDP, partly due to the increase in the State's share in central taxes following the implementation of the fourteenth Finance Commission recommendations.
NDA's revenue mobilisation strategy revolved around increasing indirect tax collections on one hand, through GST rollout and levying high excise duties on petroleum-products, and expanding the income tax base on the other. Central Board of Direct Taxes (CBDT) data show that the number of individual income taxpayers with positive tax payment increased from 1.25 crore in 2012-13 (assessment year) to 2.08 crore in 2021-22 (assessment year). The average tax paid per individual income tax payer more than doubled from Rs. 91200 to Rs. 2.03 lakh in 2021-22. This raised income tax revenues from the UPA years' annual average of around 2% of GDP to 2.3% under NDA-I and 2.9% during NDA-II.
In sharp contrast, however, corporate tax collections fell as a share of GDP, from the UPA era average of 3.5% of GDP to 3.3% under NDA-I and further to 2.8% under NDA-II. Aggregate income tax collections are projected to surpass corporate tax collections by over Rs. 1.13 lakh crore in 2024-25.
CBDT data show the number of companies paying positive taxes rising from 3.45 lakh in 2012-13 (assessment year) to 4.57 lakh in 2021-22 (assessment year). Yet, data from the "Statement on Revenue Impact of Tax Incentives under the Central Tax System", annexed with the Receipt Budgets, show that the effective corporate tax rate, which inclusive of the dividend distribution tax had risen from 24.2% in 2012-13 to 30.4% in 2018-19, had fallen sharply to 22.2% in 2020-21.
The withdrawal of the dividend distribution tax and sharp reduction in the corporate tax rate through the new tax regime introduced in 2019-20, have led to massive revenue losses under the NDA-II government, whose estimates the government has suppressed till date. Such a revenue mobilisation strategy, while transferring income from the poor (through enhanced indirect taxes) and middle classes (through income taxes) to the profit-making corporate sector, besides exacerbating income inequality, has also failed to generate adequate revenues at a time when public expenditure was being enhanced under NDA-II, following the onset of the pandemic and recession.
As a result, the revenue deficit has eventually bloated to an average of 4.3% of GDP under NDA-II and the fiscal deficit averaging at 6.6%, raising the central government's debt from 52% of GDP at the end of UPA rule and around 50% under NDA-I to the current level of 58%. Annual interest expenditure has also risen from the low of 3.0% earlier to 3.6% of GDP in the current period. That is why there were major cutbacks on capex, subsidies and welfare expenditure in the interim budget.
It is also noteworthy, that despite the enhanced level of resources transferred to the States in the past ten years, combined debt of the State Governments have grown faster than that of the centre under NDA rule than the UPA era. This underlines the inadequacy of current level of fiscal transfers to the States, given their expanding expenditure commitments.
Economic Performance
Official data on the real economy under the NDA regime has been criticised from several quarters for overestimating its own macroeconomic performance and undervaluing that of the UPA regime. Even then, the simple truth which is evident from the official data is that on average, real GDP growth was at least one percentage point higher during the UPA decade than that of the NDA.
Not only did the deep slump following the pandemic and lockdown cause major disruption during NDA-II, but slowdown in the economy was already evident under NDA-I after the successive policy shocks of demonetisation and GST rollout. The UPA era had witnessed the global financial crisis and consequent worldwide recession during 2007-09, which was also a major external shock. The government's white paper has omitted any mention of that global crisis or the 2016 demonetisation episode.
Gross value added (GVA) growth in basic prices reflects the same trend as real GDP, with the average growth rate first rising during UPA I, then falling during UPA II, rising again in the NDA I period and then falling sharply during NDA II. Most importantly, the ten years of NDA rule could not provide any break with the sectoral pattern of growth witnessed during the UPA era. Agricultural growth remained way below the overall GVA growth rate, with its share in overall GVA falling continuously. With the share of manufacturing and industrial sectors remaining largely the same under UPA and NDA periods, the services sector's share in GVA increased from below 48% in 2008-09 to over 54% in GDP. The Make in India initiative launched by the NDA, to transform India into a "global manufacturing hub", could not succeed in altering the services-led growth trajectory.
Real investment and export growth was significantly higher during the UPA decade than the NDA's, which explains the cause of higher real GDP growth during the former regime, despite being interrupted by a global recession. Private investment (GFCF) as a share of nominal GDP during the UPA decade remained significantly higher than in the later period. In contrast, growth during NDA-I was private consumption led. During NDA-II's tenure, even real private consumption growth fell significantly, making economic growth largely dependent on the fiscal stimulus. This is clearly borne out by the rising fiscal deficit and debt-GDP ratio under NDA-II.
UPA's growth record, although higher than NDA's in magnitude, had three major problem areas, which the Finance Ministry's "White Paper" has highlighted. What is missing though is an honest appraisal of how far the NDA regime has been able to address and resolve them.
The most problematic aspect of the UPA era's growth process was the high inflation that accompanied it, particularly the double digit food inflation. The new series of CPI data reflect a sharp decline in the overall consumer inflation rate by the end of NDA-I's tenure to 3.4%, but a resumption of the inflationary trend under NDA-II, averaging around 6% annually. As was the case with the UPA regime, NDA too has relied upon the Reserve Bank of India to try and control inflation by raising its policy interest rate and managing liquidity. Despite the repo rate being hiked from 4% in mid-2020 to 6.5% in February last year, where it has been held till date, the headline inflation rate has stubbornly ranged between 5-7% in the past two years, with average food inflation crossing 7% in 2023-24. This demonstrates, as it did during the UPA era, that RBI's repo rate adjustments have very little influence on food price movements in India.
The NDA regime has done little to address the major supply side factors driving food inflation, beyond imposing ad hoc export bans. Cash transfer schemes like PM-Kisan or distribution of free foodgrains to the poorer households can provide much needed income support and relief, but neither can they improve agricultural productivity nor modernise storage and marketing of food items like vegetables, pulses and cereals, whose prices are driving food inflation today. The only method conceived by the NDA to address these issues was to facilitate a wholesale takeover of India's food and agricultural economy by enacting three farm laws in September 2020, which had to be eventually rescinded following a year-long protest by North Indian farmers. Since then, the NDA-II government has remained as clueless as the UPA-II was, in dealing with food inflation and agriculture.
The second problem with UPA's growth story was that while exports grew rapidly, imports grew even faster, partly due to rising global crude prices, which worsened the current account balance and increased external vulnerability. During the NDA regime, both export and import growth declined, which impacted economic growth adversely but improved the external trade balance. Further, during the NDA decade, net FDI inflows increased as a share of GDP but remittance inflows, which remained significantly higher than net FDI inflows, declined compared to the UPA decade. The end-result has been mixed.
The fall in India's foreign exchange reserves during NDA-I could be reversed during NDA-II, but the rupee has continued to depreciate vis-a-vis the dollar. The rupee-dollar exchange rate, which fell from Rs 43 to Rs 60 per dollar during UPA rule, has fallen even further to Rs 83 during NDA's tenure. In the context of the post-pandemic surge in global inflation last year, rupee depreciation has only imported the inflationary trend into the domestic economy.
The third problem with UPA's higher growth and private investment phase emerged through rising big ticket corporate defaults, initially concealed through debt restructuring, which ultimately left a huge pile of legacy non-performing assets (NPAs) in the banking system. The Modi government is claiming credit for restoring the health of the public sector banks (PSBs) by reducing the GNPA stock significantly. The fact remains that while cumulative NPA reduction under the NDA rule through all recovery channels, including the Insolvency and Bankruptcy Code was around Rs. 10.8 lakh crore (till March 2023), NPA write-offs have amounted to over Rs. 14.8 lakh crore in the same period.
The PSBs, which accounted for over Rs. 10.65 lakh crore of these NPA write offs had to absorb substantial losses because of NPA provisioning, making net losses between 2017-18 and 2019-20. Simultaneously, since 2017-18 massive doses of capital was infused into the PSBs and financial institutions like EXIM Bank, IDBI and IIFCL, in order to bail them out. As disclosed in the Receipt Budgets, the centre's total debt burden on account of these recapitalisation bonds have increased to Rs. 2.90 lakh crore by 2023-24, and their annual interest expense of over Rs. 19000 crore is being met through central government's revenue expenditure since 2019-20. Thus, massive NPA write-offs by the PSBs have been subsidised through the public exchequer.
Income and Employment
In the ultimate analysis, the efficacy of union budgets and macroeconomic performance needs to be judged in terms of their impact on the lives of ordinary people. The Finance Minister claimed in the budget speech that under NDA rule "People are living better and earning better, with even greater aspirations for the future. Average real income of the people has increased by fifty per cent." How true is this claim?
Official data show that real per capita income in India, estimated by inflation adjusted Net National Income (NNI), registered a growth of 50.3% during the ten years of UPA rule. During NDA's ten year rule, real per capita income grew by 43.6% only, reflecting a slowdown in inflation adjusted income growth across India.
The NDA government often cites the annual Periodic Labour Force Survey findings to claim a reduction in the unemployment rate between 2017-18 and 2022-23. However, comparable estimates from the NSS 68th round on Employment and Unemployment Situation in India, show that unemployment rates, estimated by both current weekly status and adjusted usual status, grew very sharply between 2011-12 to 2017-18.
Moreover, while the unemployment rates declined between 2017-18 and 2022-23, the open unemployment rates of 2022-2023 were still higher, not only vis-a-vis the NSS 68th round of 2011-12, but compared to all the eight previous NSS rounds conducted since 1972-73. The open unemployment rates have never been so high in India in the last fifty years. Unemployment was particularly high among the urban youth aged 15 to 29 years and among those with educational level of secondary and above.
Even as agriculture's share in gross value added has declined to 14.4% in 2023-24, there has been an increase in the share of workers engaged in agriculture between 2017-18 and 2022-23. The share of workers engaged in informal non-agricultural enterprises has also increased progressively since 2011-12. These trends in employment status from the PLFS data point towards growing informalisation of the labour force, contrary to the official claims of increased formalisation.
The Finance Minister had claimed in the budget speech that the government's "Skill India Mission" has trained 1.4 crore youth and 54 lakh youth have been upskilled and reskilled. However, the dashboard in the official site of the PM Kaushal Vikas Yojana shows that out of 1.10 crore certified candidates, only 24.51 lakh, i.e. around 22% who have been "Reported Placed". Such excess supply of skilled workers in the economy and growing informalisation is working as a dampener on wage and earnings growth.
PLFS data further show that average earnings of casual labour in non-public work to be Rs. 8547 in 2022-23, that of self-employed workers Rs. 13347 and that of regular wage/salaried workers Rs. 20039. While casual labourers' average earnings have grown by around 49% in five years since 2017-18, and regular wage/salaried workers by 19%, average earnings of self-employed workers rose by 8.5% only in 5 years. With annual retail inflation rate averaging 6% during NDA-II's tenure, less than 2% annual growth in average earnings for the self-employed clearly indicates a decline in their real earnings. 57% of India's labour force engaged in self-employment, are certainly not "living better and earning better", as the Finance Minister would want us to believe.
Budget 2024: Tall claims based on Half-Truths and Manipulations
CPI(ML) Statement | 1 February 2024 The Interim Budget 2024 is a propaganda piece boasting performance of BJP Govt of last ten years in an election year by selective use of data, relying on half-truths and distortions. The budget revised estimates numbers bring out that the government has not been able to make actual outlays for many of its flagship programs. The actual revised estimates for F.Y. 2023-24 for much talked about PM Awas Yojana has been put at Rs 54,103 Crore (Budget 2023 Estimate Rs 79,590 Crore), Swachh Bharat Mission Rs 2,550 Crore (Budget 2023 Estimate Rs 5,000 Crore) and PM Ayushman Bharat Health Infrastructure Rs 2100 Crore (Budget 2023 Estimate Rs 4,000 Crore). The government has been talking about increasing farmers’ incomes but the real numbers of revised estimates bring out that Urea subsidy has been slashed to Rs 1,28,594 Crore in comparison to Actual Expenditure of FY 2022-23 at Rs 1,65,217 Crore and Nutrient based subsidy has been brought to Rs 60,300 Crore from actual expenditure of Rs 86,122 Crore in FY 20223-23. This is clear that the government is taking away from one hand from farmers and giving it from another in the form of PM Kishan Nidhi where farmers are being paid Rs 6,000 per year as income support. The actual cut in urea and nutrient subsidy from last year of Rs 62,445 Crore is more than the expenditure on PM Kisan Nidhi of Rs 60,000 Crore. The budgeted provision for urea and nutrient subsidy at Rs 1,19,000 Crore and Rs 45,000 Crore is even less than the actual expenditure which indicates in direction of further cut in these subsidies. The budgeted food subsidy of Rs 2,05,250 Crore is lower than revised estimates of Rs 2,12,332 despite claims of garib kalyan. The much talked about skill development mission for skilling youth has paltry allocation of Rs 538 Crore for supposed skilling and reskilling of crores of unemployed and underemployed youths of the country. The refusal to increase taxes on big corporates and the ultra-rich has resulted in high fiscal deficit, in revised estimates it is pegged at 5.8 percent of GDP. The Debt to GDP ratio has worsened in ten years from 67% to 82% of GDP. Out of the total revised estimates of Rs 44.90 lakh crore of total expenditure, Rs 10.55 lakh crore is utilized only in service of interest payments which is about Rs 1 in every Rs 4. The government has been known to shift goal posts and create severe distractions and the interim budget 2024 presented today does the same. The latest RBI Consumer Confidence Survey reveals that more than 80 percent of the population, which falls under the low income categories – with monthly earnings of less than Rs. 25000, Rs. 10000 and Rs. 5000 per month – are facing the brunt of Modi’s economic policies. The people in these income groups see their economic situation worsened to a great extent during the last one year. Recently, the Caste Census of Bihar, which also is a reality check for the whole of India, indicated the actual scale of poverty where SC-ST, OBCs and minorities are economically more deprived while the general state of economy has worsened for all. Modi-Shah regime’s manufactured perception and false claims of economic growth in the name of Achhe Din and Amrit Kaal, promoted by the rich, are bound to have the same fate as was of ‘India Shining’ in Atal-Advani era, in the coming parliamentary elections. |